> ## Documentation Index
> Fetch the complete documentation index at: https://docs.nekt.com/llms.txt
> Use this file to discover all available pages before exploring further.
# Looker Studio
> Connect Looker Studio to your data in Nekt to build reports and dashboards.
Connect Looker Studio to your data in Nekt. How you connect depends on your cloud deployment.
| | Connector | Token required |
| :--------------- | :----------------------- | :------------- |
| **Nekt Express** | Google BigQuery (native) | No |
| **GCP** | Google BigQuery (native) | No |
| **AWS** | Nekt custom connector | Yes |
***
## Nekt Express
Nekt Express uses GCP infrastructure. Connect via the native BigQuery connector using the shared Nekt project.
### Step 1: Register the integration in Nekt
1. In the Nekt platform, go to **Integrations** and click **Add integration**.
2. Select **Looker Studio** from the list.
3. Enter the email address associated with your Looker Studio account.
4. Add a description to identify this integration.
### Step 2: Choose the BigQuery connector
1. [Sign in to Looker Studio](https://lookerstudio.google.com/). Use the same email registered in step 1.
2. Click **Create** → **Data Source**.
3. Select the **BigQuery** connector.
4. If prompted, click **AUTHORIZE** and allow the necessary permissions.
### Step 3: Set the Project ID
When prompted, enter the following Project ID:
```
nekt-hosted-infrastructure
```
Press **Enter** to confirm. This is only required the first time — subsequent connections will recognize it automatically.
### Step 4: Select the data and explore
1. Browse to the dataset and table you want to connect.
2. Click **Connect** in the top-right corner.
3. You will see a column preview. Click **Explore** or **Create Report** to proceed.
***
## GCP
Your Nekt workspace is hosted on your own GCP account. Connect directly to BigQuery using your project.
### Step 1: Choose the BigQuery connector
1. [Sign in to Looker Studio](https://lookerstudio.google.com/).
2. Click **Create** → **Data Source**.
3. Select the **BigQuery** connector.
4. If prompted, authorize with your GCP account email and click **Allow**.
### Step 2: Select the data and explore
1. Under **My Projects**, find and select the table you want to connect.
2. Click **Connect** in the top-right corner.
3. Click **Explore** or **Create Report** to proceed.
***
## AWS
Your Nekt workspace is hosted on your own AWS account. Connection is made through **Nekt's custom Looker Studio connector**, which requires a scoped access token.
### Step 1: Generate a token
1. In the Nekt platform, go to **Integrations**, find **Looker Studio**, and click **Configure**.
2. Create an access token and select the tables you want to make available. You can select tables from any Lakehouse layer.
The token grants access only to the tables selected here. You can create multiple tokens to give access to different sets of tables, which is useful for data governance.
3. Click **Next**.
4. Give the integration a description (this helps you identify it later). Optionally, add a link to the report.
5. Click **Next**, then copy the generated token from the Integrations page.
### Step 2: Open Nekt's connector
Access Nekt's Looker Studio connector directly via this link:
[Open Nekt connector in Looker Studio](https://lookerstudio.google.com/datasources/create?connectorId=AKfycbwFfHPxHQzcxVuHeIbCoMywA1UjGCv0YY2gD9N1pnQ)
On your first use, click **AUTHORIZE** and complete the Google sign-in. Click **Allow** to confirm permissions.
### Step 3: Configure the connection
Fill in the access parameters:
1. **Nekt data visualization token**: paste the token generated in Step 1.
2. **Table**: select the table to connect (Looker Studio connects one table at a time).
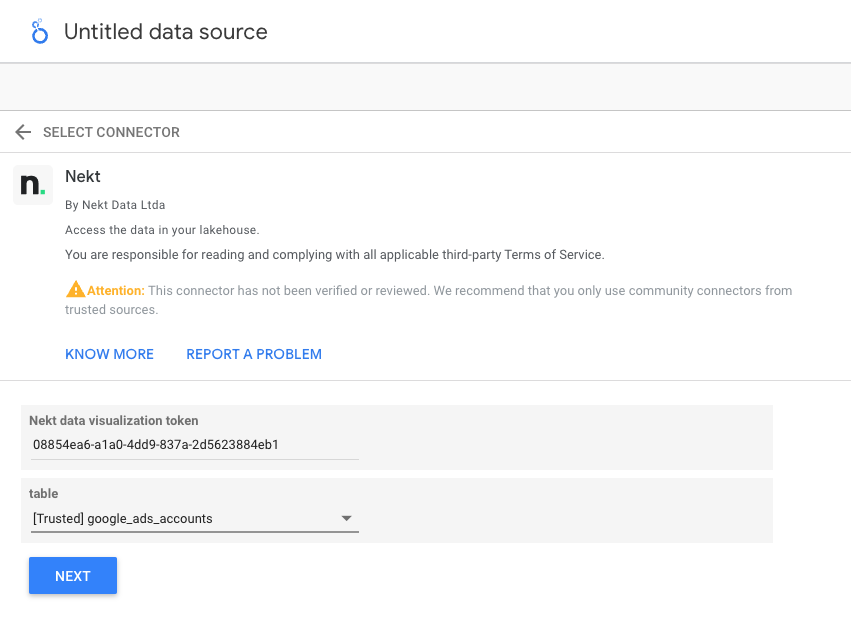 Click **NEXT** and configure optional parameters:
* **Date range column name**: the column to use when applying date range filters in reports.
* **Row limit**: maximum rows per query. Default is `1000`. Set to `-1` to fetch all rows.
Click **NEXT** and configure optional parameters:
* **Date range column name**: the column to use when applying date range filters in reports.
* **Row limit**: maximum rows per query. Default is `1000`. Set to `-1` to fetch all rows.
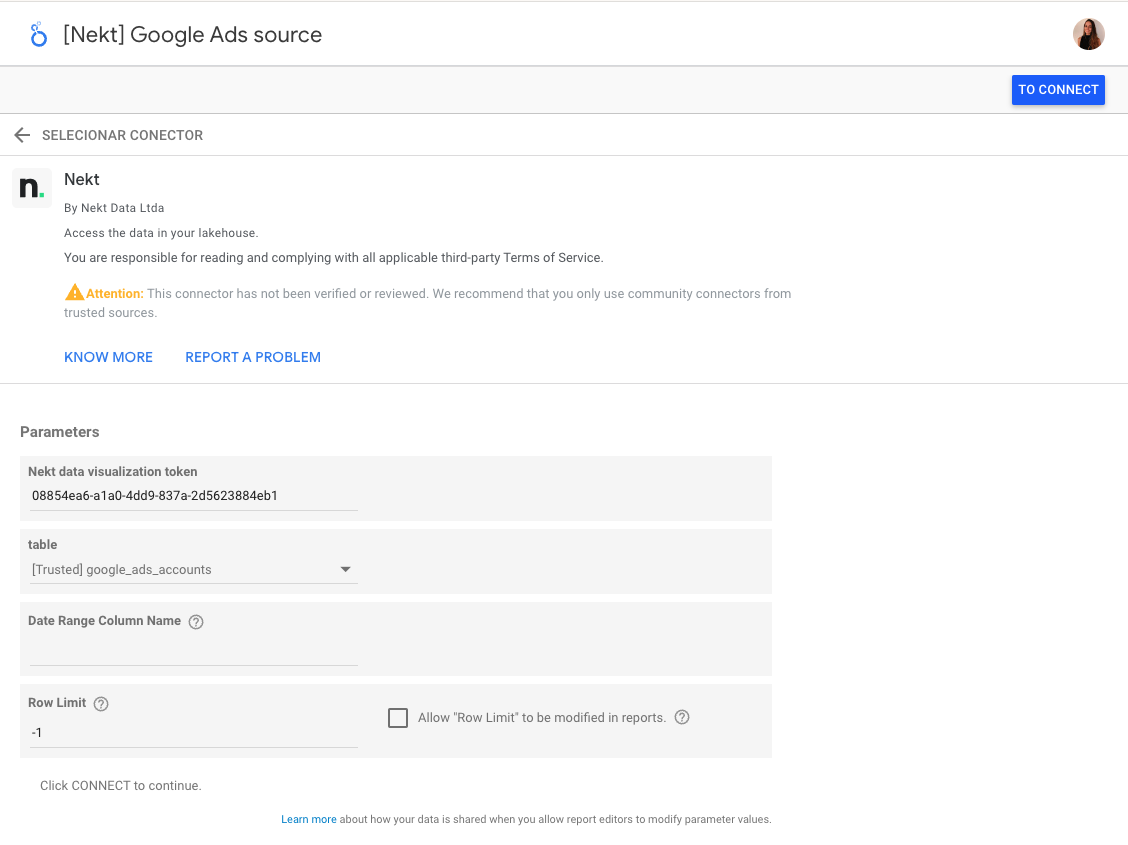 You can name the data source at the top of the page.
### Step 4: Connect and explore
Click **Connect** in the top-right corner. You will see a column preview. Click **Explore** or **Create Report** to proceed.
You can name the data source at the top of the page.
### Step 4: Connect and explore
Click **Connect** in the top-right corner. You will see a column preview. Click **Explore** or **Create Report** to proceed.