> ## Documentation Index
> Fetch the complete documentation index at: https://docs.nekt.com/llms.txt
> Use this file to discover all available pages before exploring further.
# Get Looker token
> Step by step guide to connect your Nekt catalog to Looker Studio
To use [Nekt's custom connector](https://lookerstudio.google.com/datasources/create?connectorId=AKfycbwFfHPxHQzcxVuHeIbCoMywA1UjGCv0YY2gD9N1pnQ) in Looker Studio, you need a token. Follow this guide to generate the token required to connect to the tables within the [Catalog](https://docs.nekt.com/catalog/overview).
If your datalake is hosted on Google Cloud Platform, you don't need the token since you're connecting directly on BigQuery.
## 1. Go to Visualizations page
Access the [Visualizations page](https://app.nekt.ai/visualizations) in the Nekt platform and click on **Add visualization**.
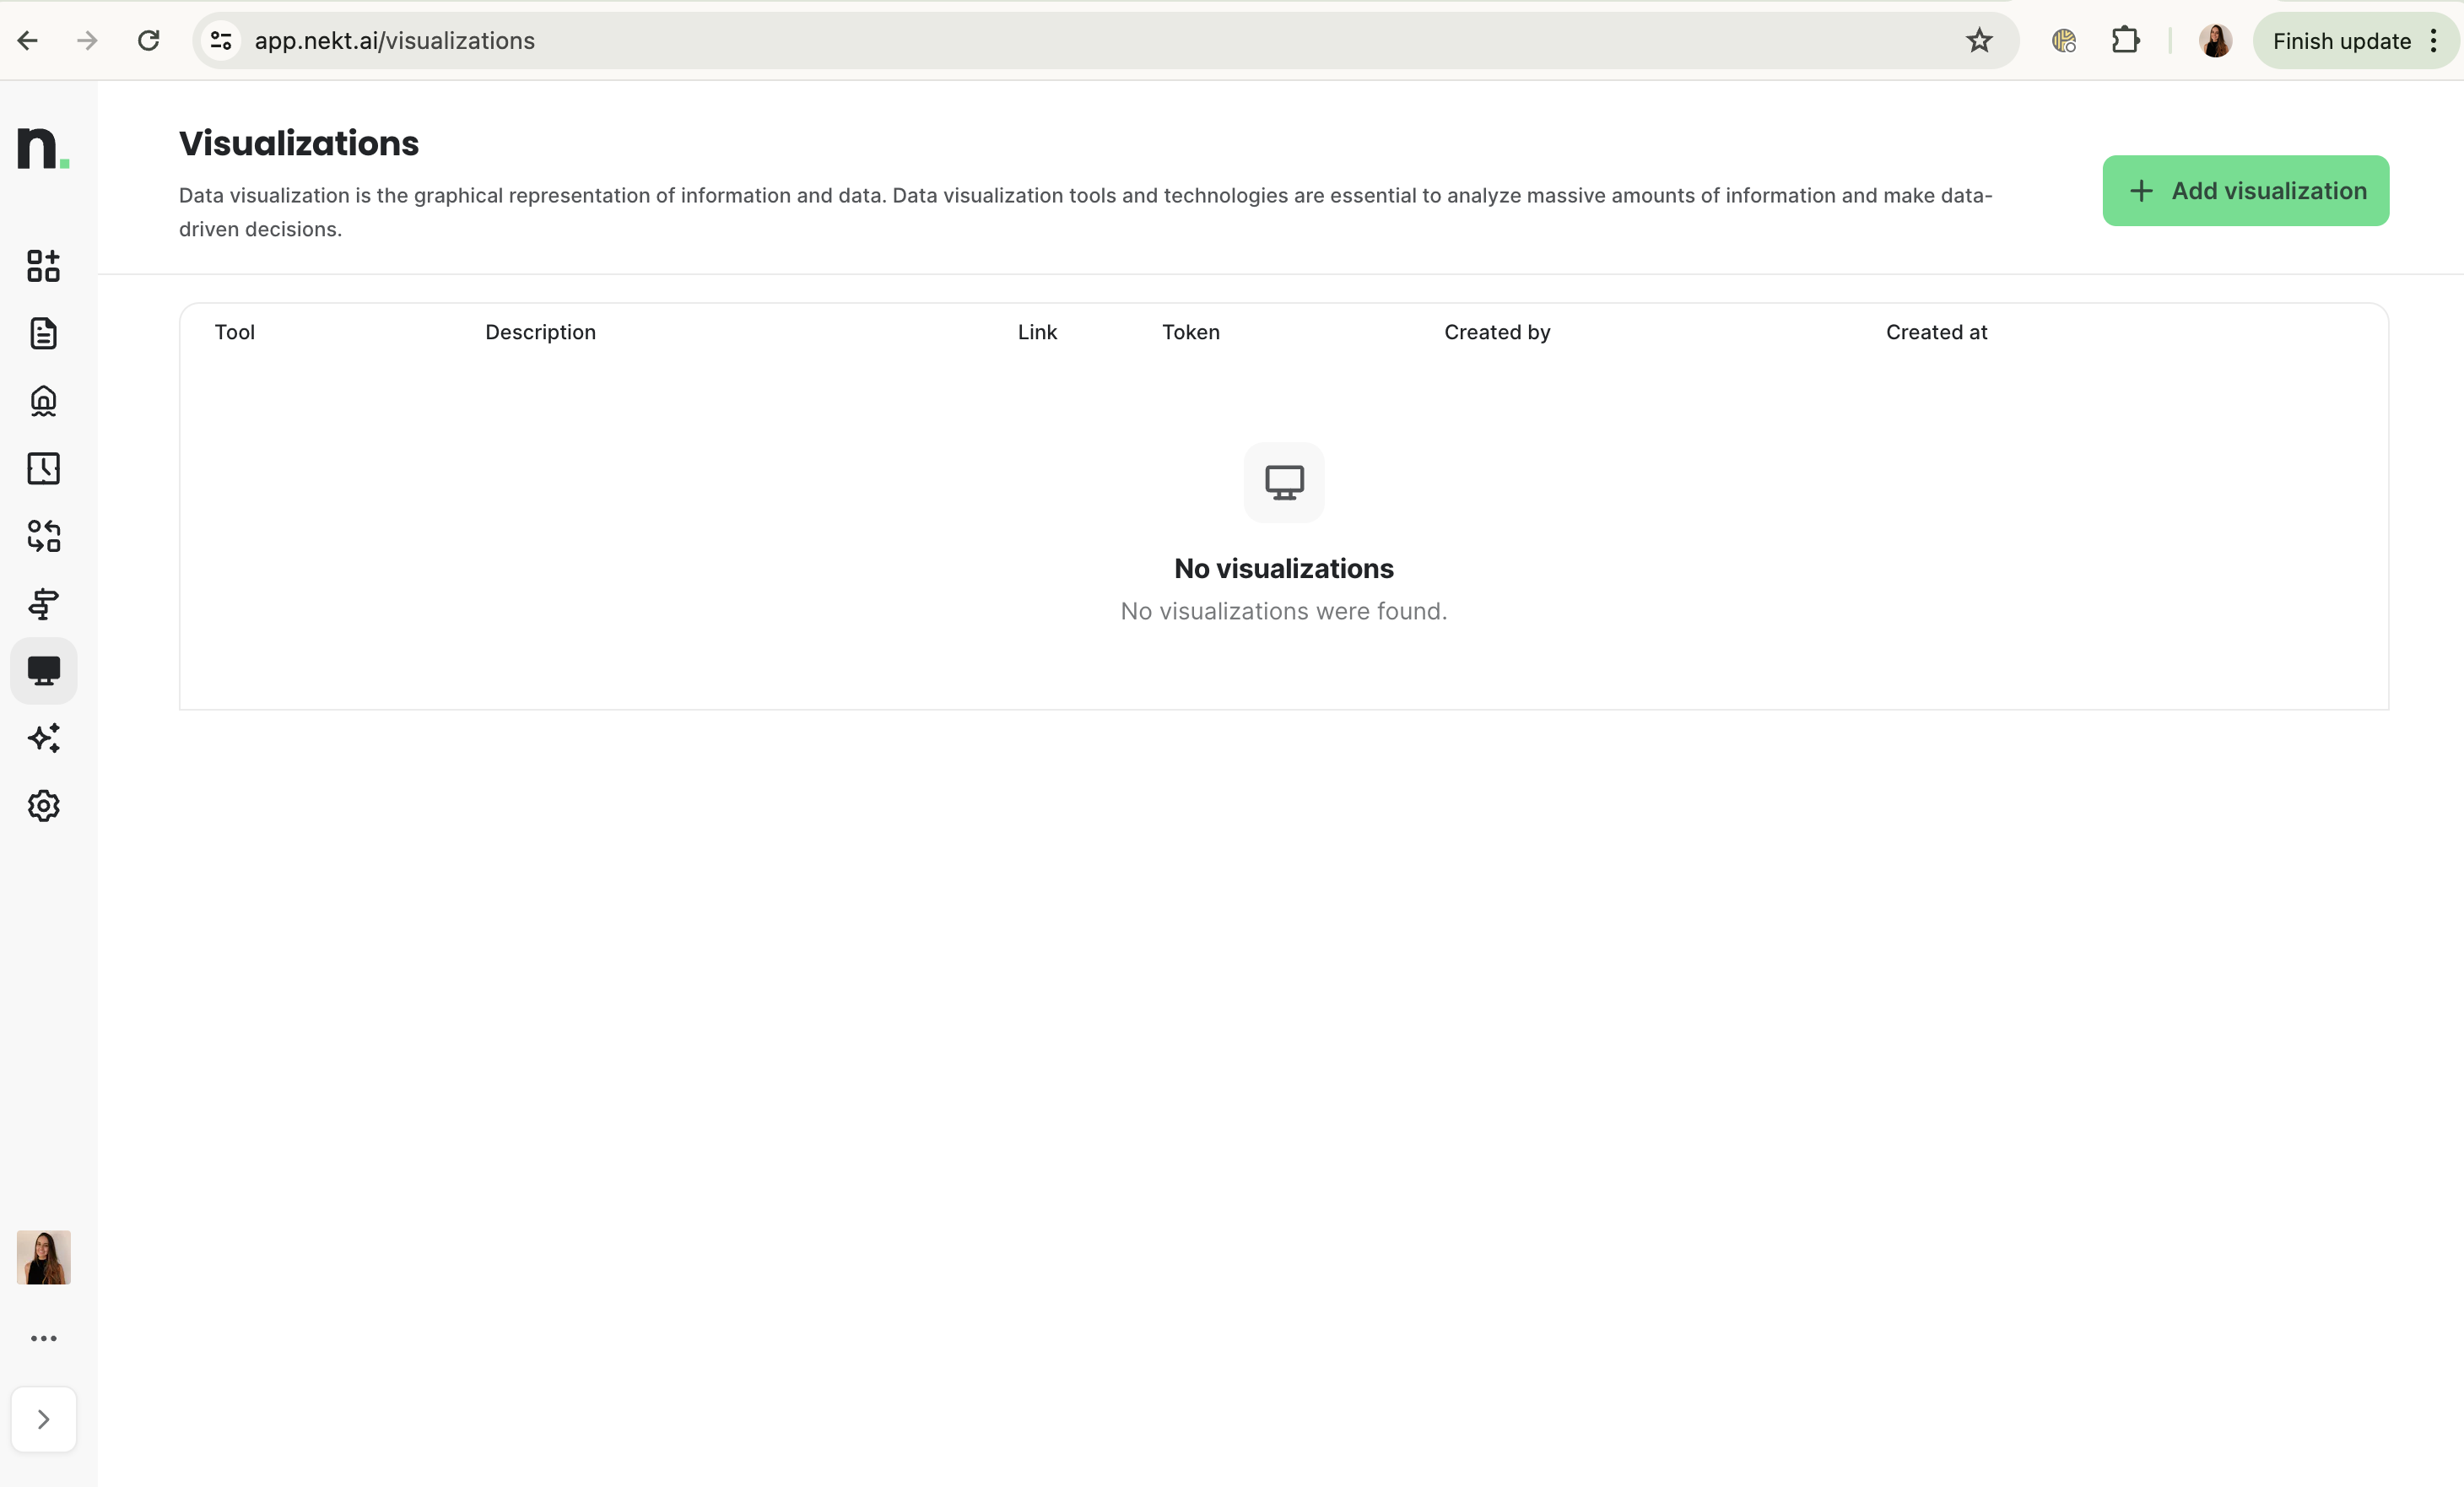 Select Looker Studio as the visualization tool you want to use. Then, click **Next**.
## 2. Configure your token
Select the tables you want to use now. From each layer of your lakehouse, you can select as many tables as you want.
> The generated token will allow you to connect only with the tables you select in this moment. You can generate multiple tokens to give access to different sets of tables - which is useful for data governance for example.
Select Looker Studio as the visualization tool you want to use. Then, click **Next**.
## 2. Configure your token
Select the tables you want to use now. From each layer of your lakehouse, you can select as many tables as you want.
> The generated token will allow you to connect only with the tables you select in this moment. You can generate multiple tokens to give access to different sets of tables - which is useful for data governance for example.
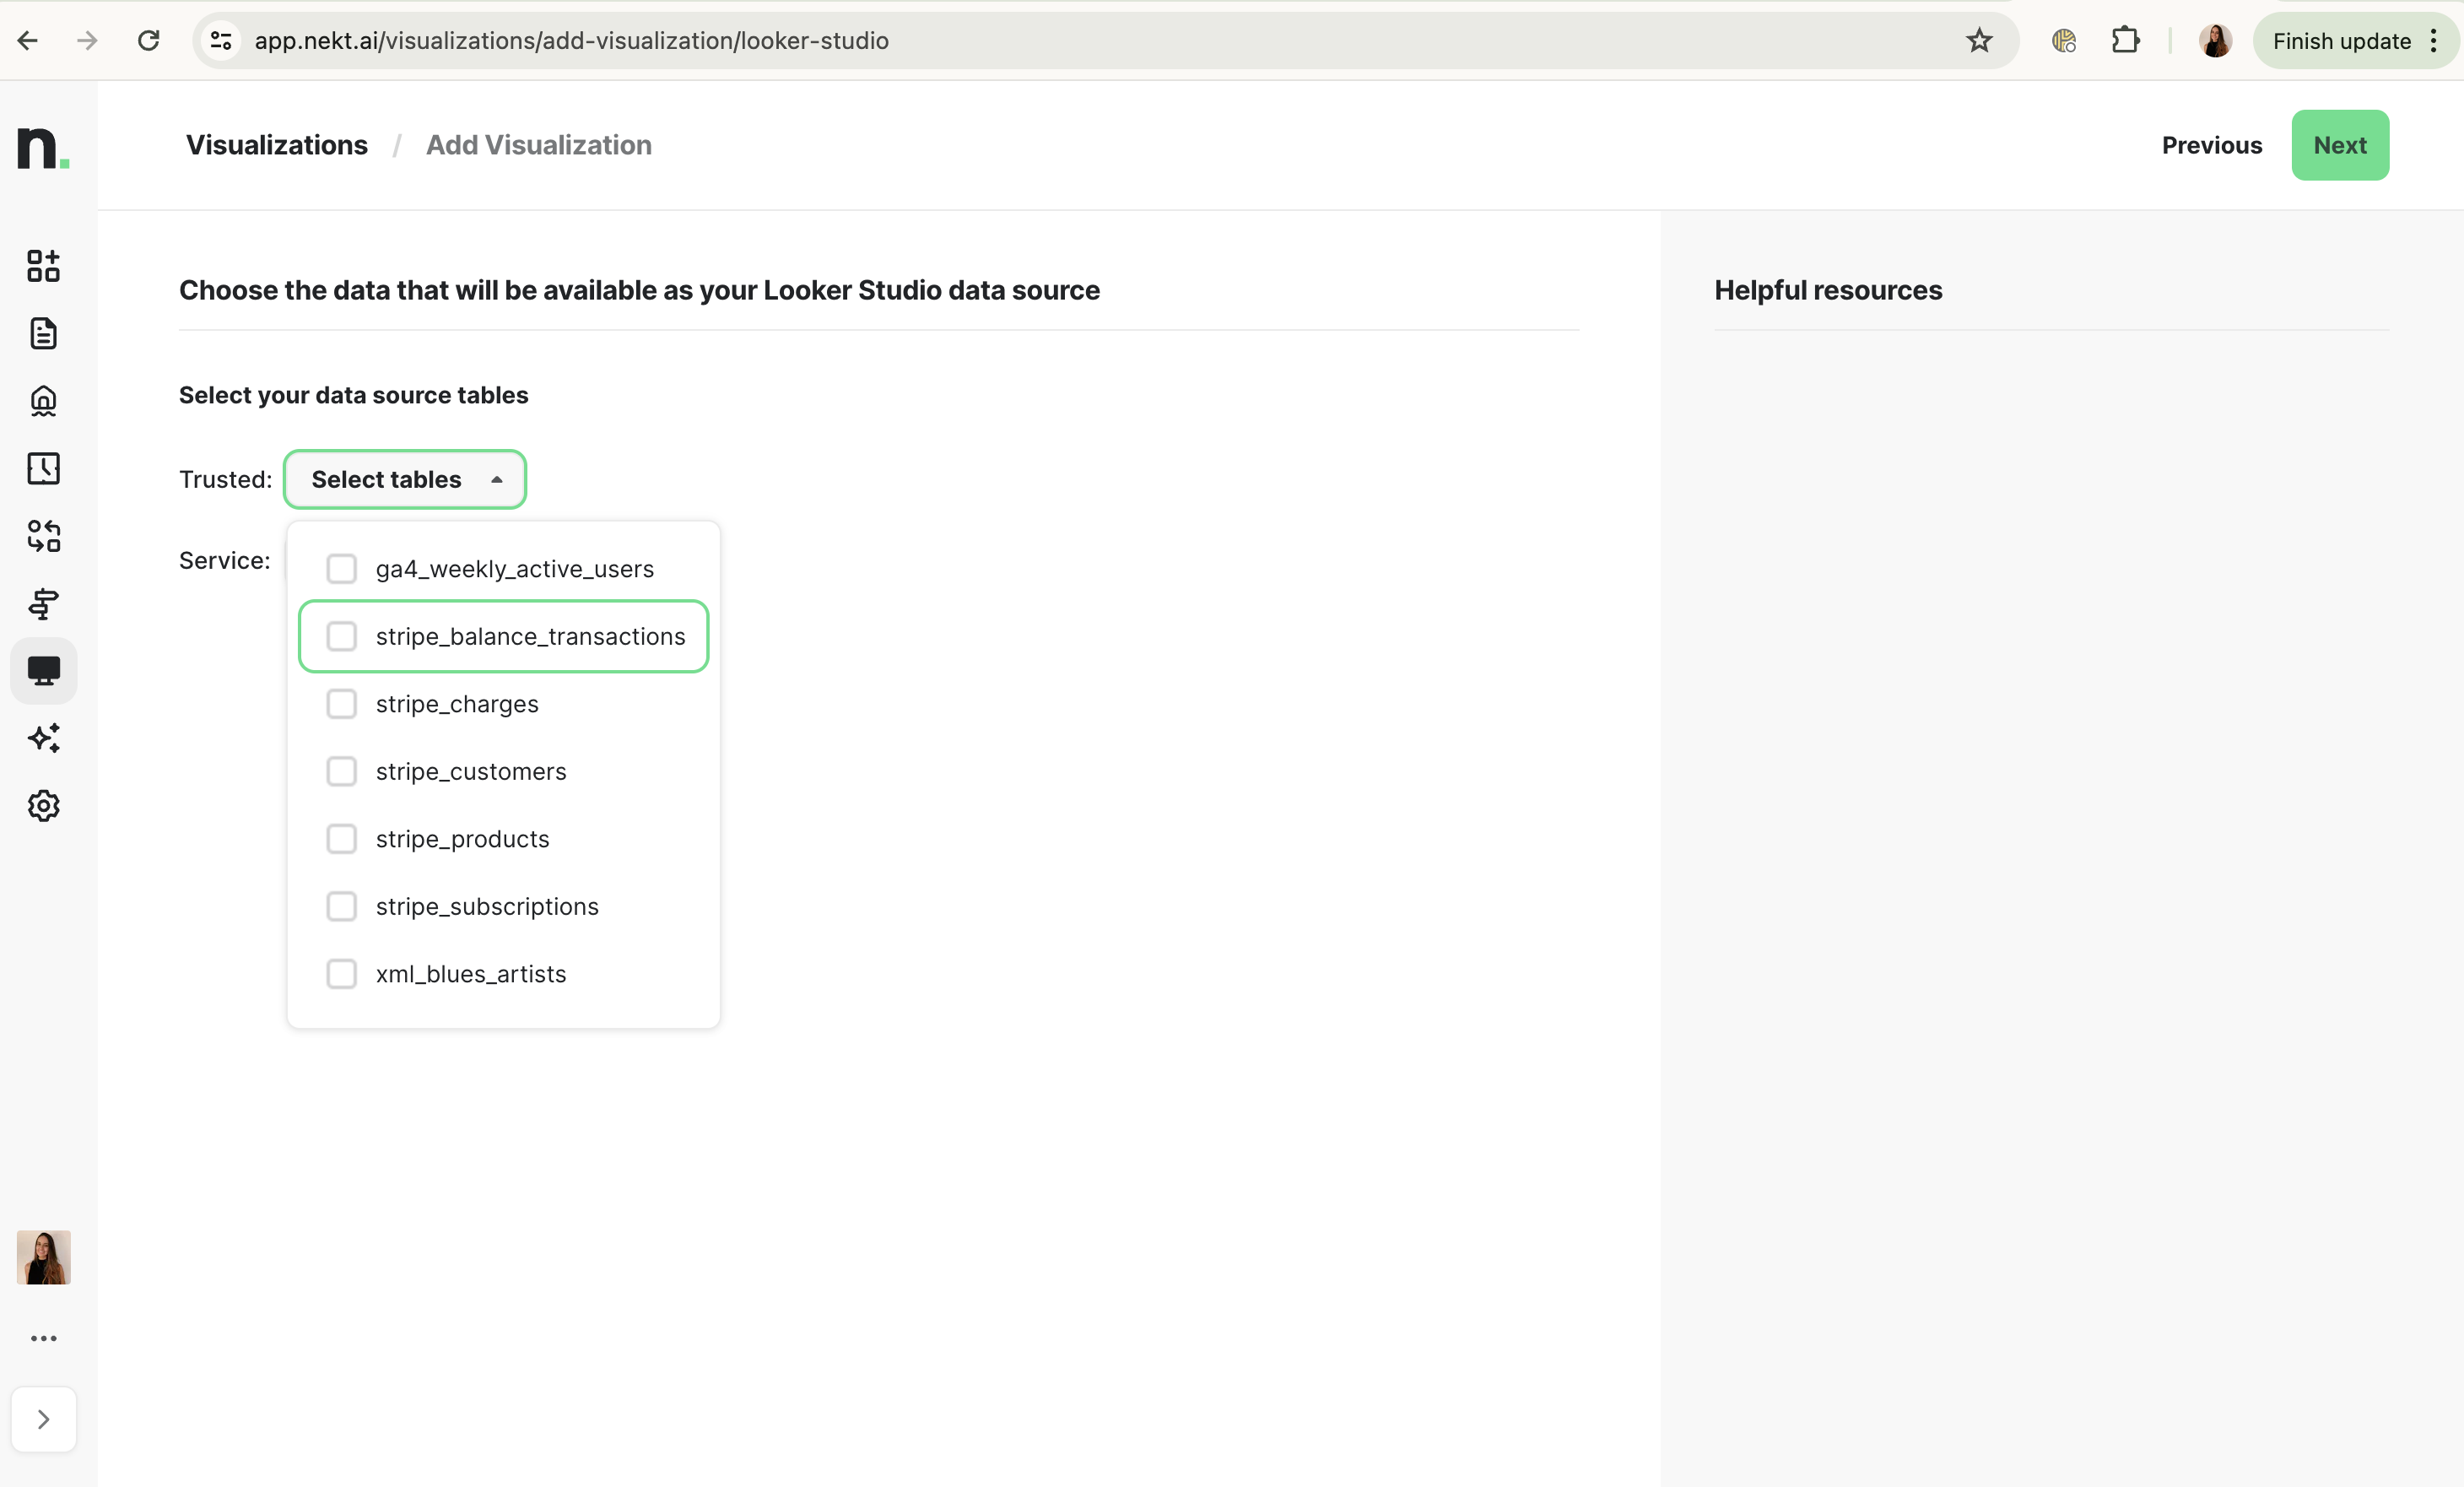 Once you are done selecting the tables your token will provide access, click **Next**.
## 3. Configure your visualization
Give your visualization a description - it will appear on the Visualizations page later and will be helpful to identify reports that use your data.
If you already have a report, you can add a link to it too. You can also add it later, from the Visualizations page.
Once you are done selecting the tables your token will provide access, click **Next**.
## 3. Configure your visualization
Give your visualization a description - it will appear on the Visualizations page later and will be helpful to identify reports that use your data.
If you already have a report, you can add a link to it too. You can also add it later, from the Visualizations page.
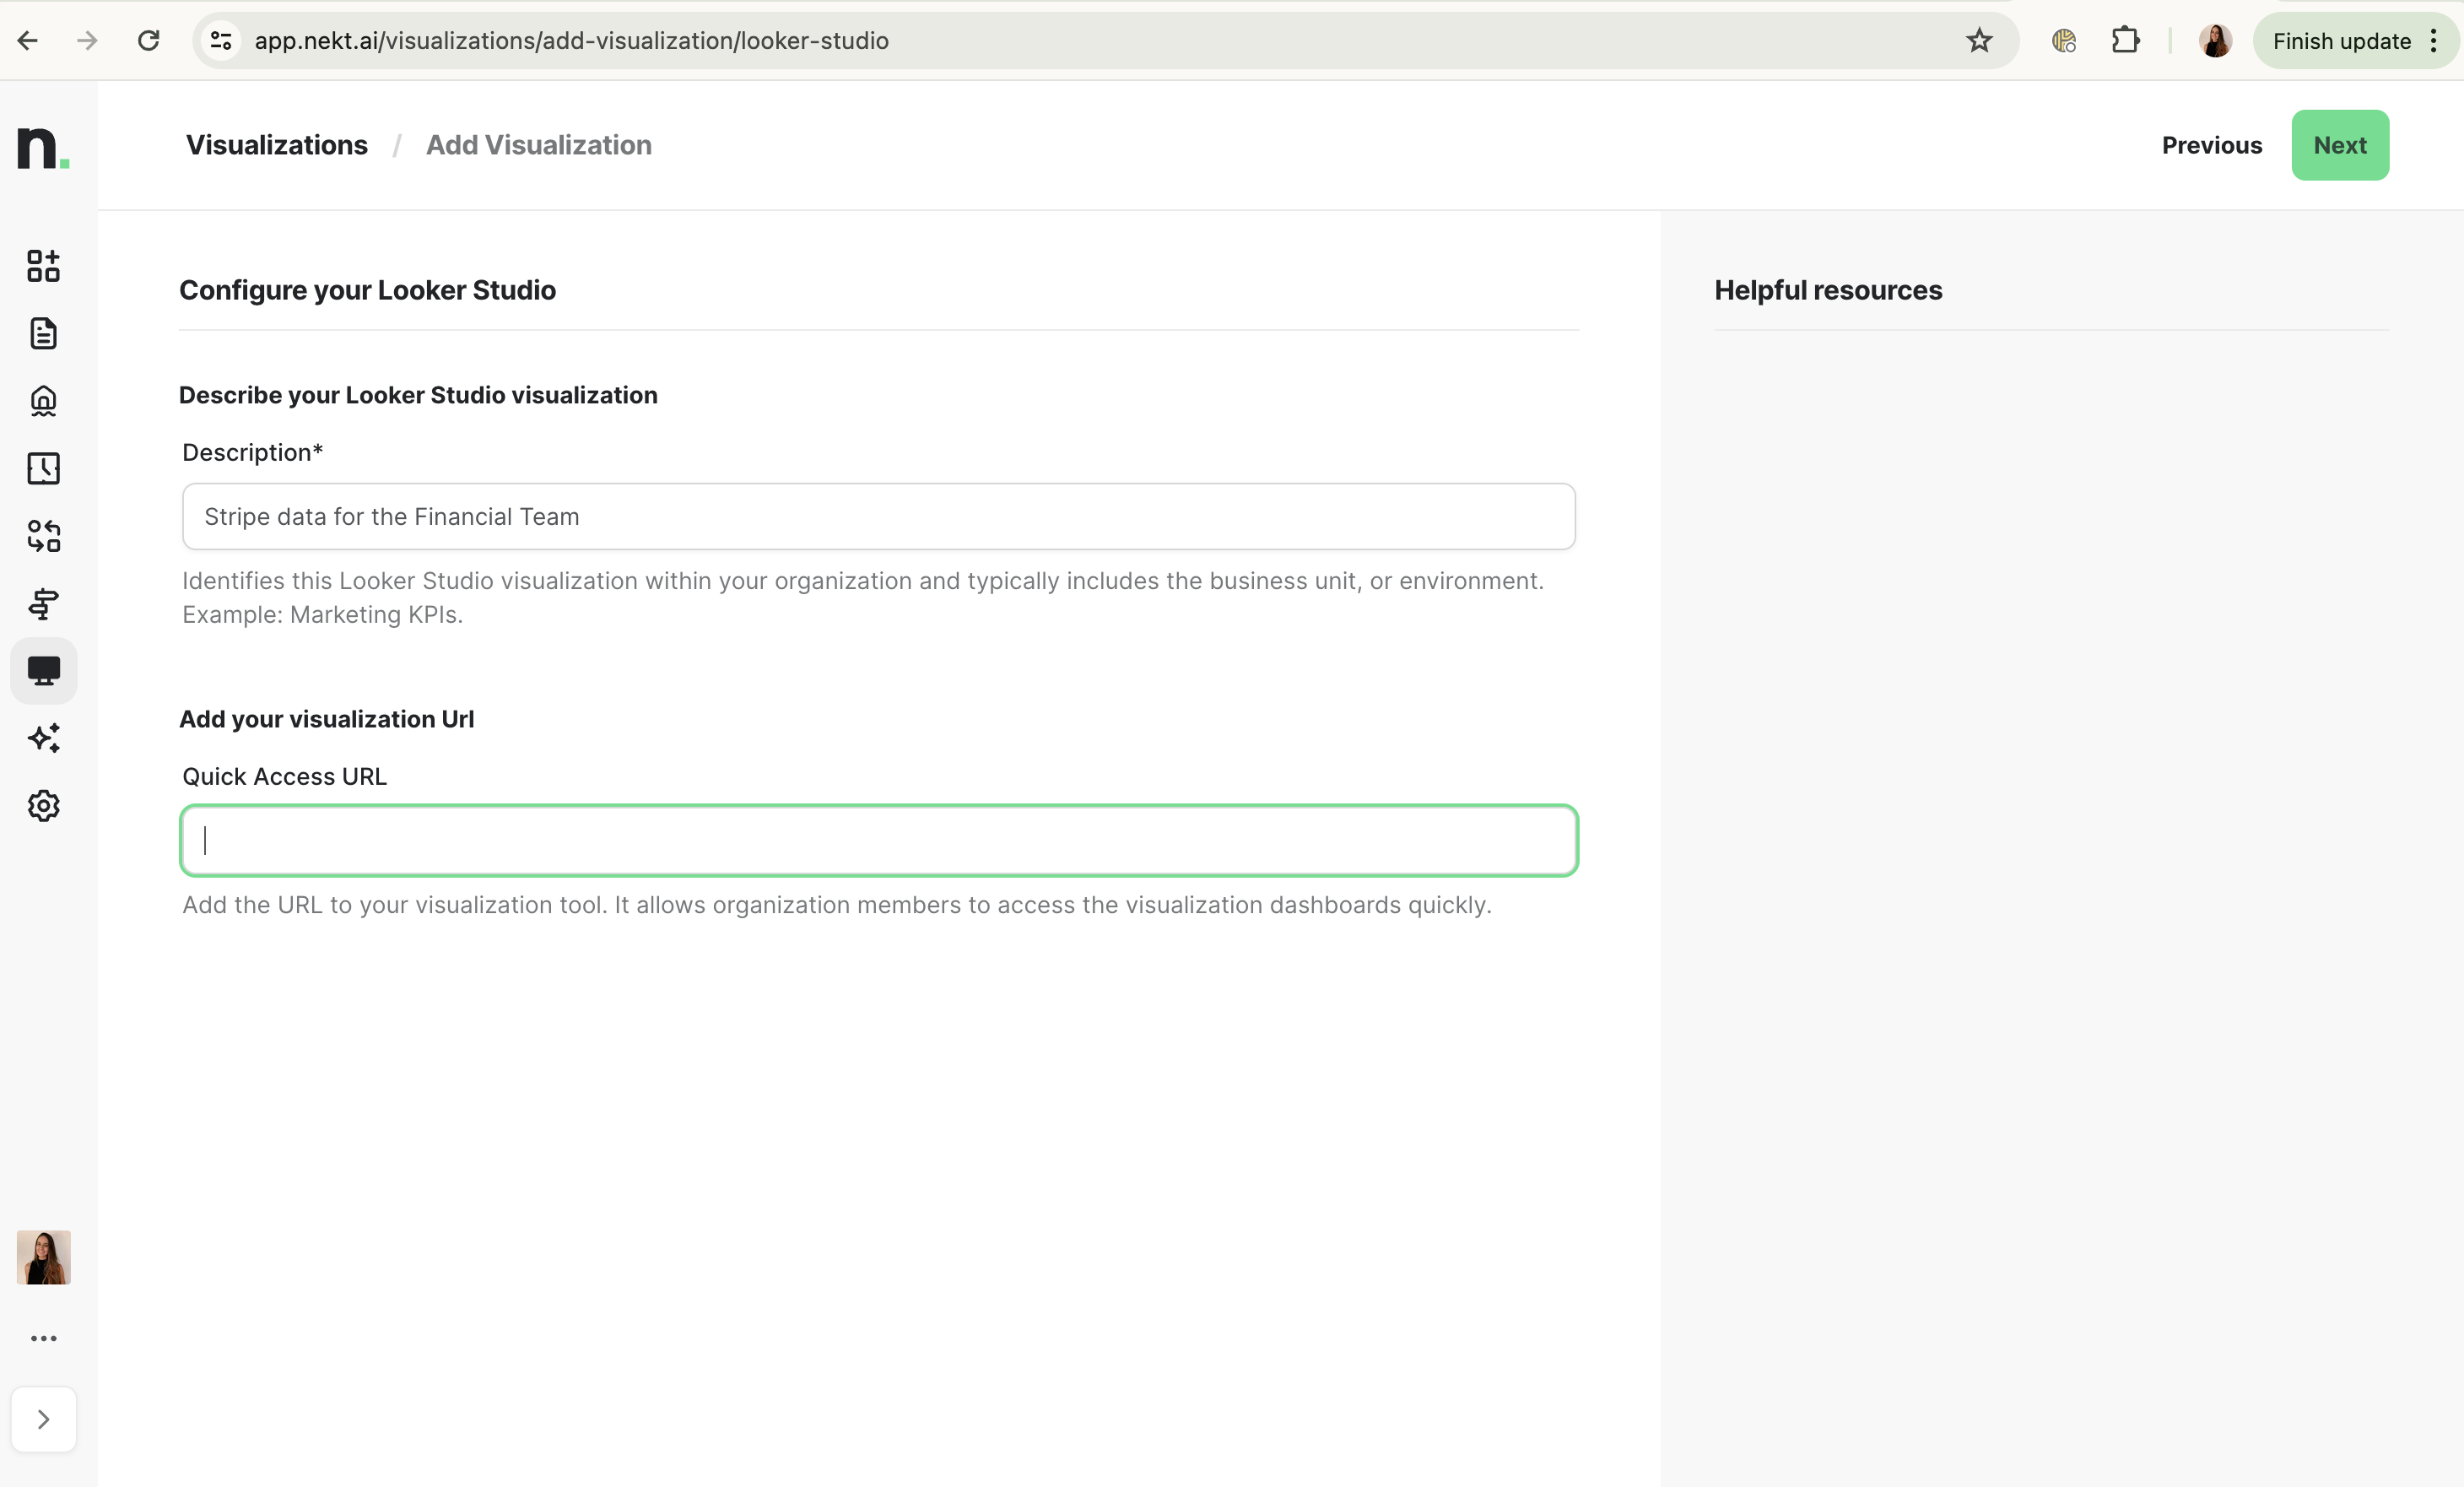 Click **Next**.
## 4. Get your token
If everything worked out, you should have received a success message. Go to the Visualizations page to see your added visualization and get your token.
Click **Next**.
## 4. Get your token
If everything worked out, you should have received a success message. Go to the Visualizations page to see your added visualization and get your token.
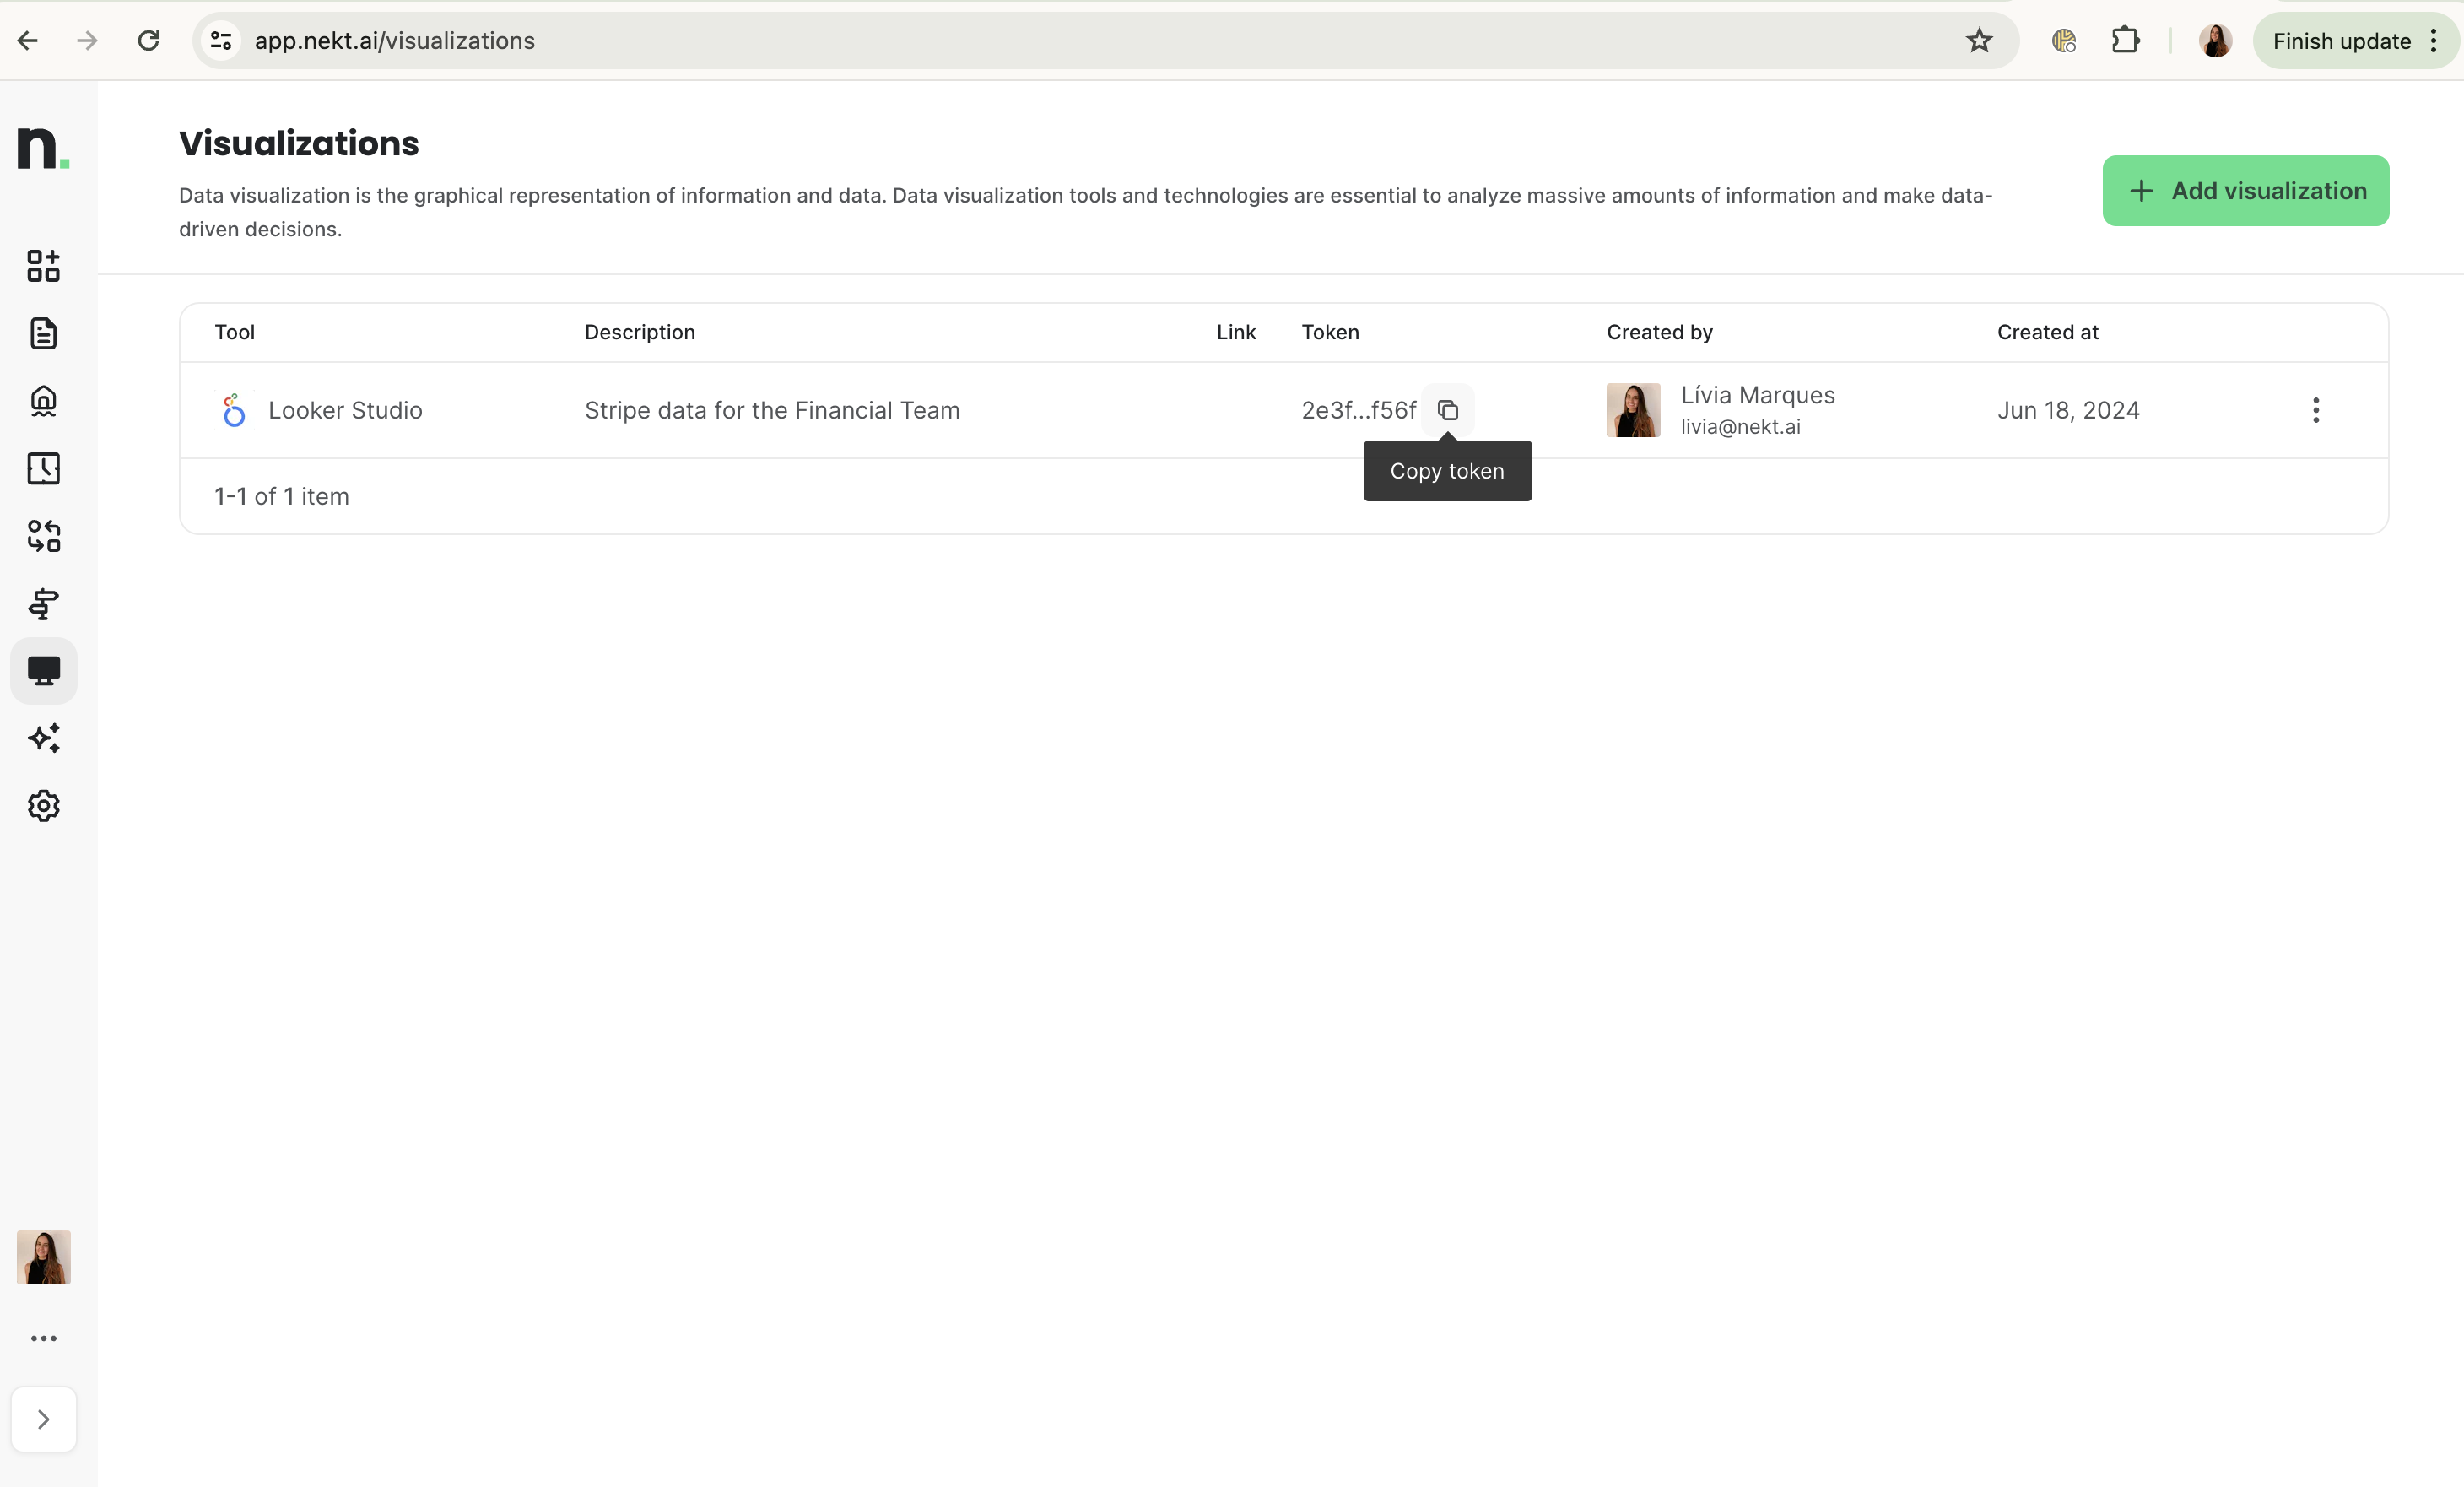 Copy your token and use it to [connect your selected tables to Looker Studio](https://docs.nekt.com/visualization/looker-studio).