1. Go to Visualizations page
Access the Visualizations page in the Nekt platform and click on Add visualization.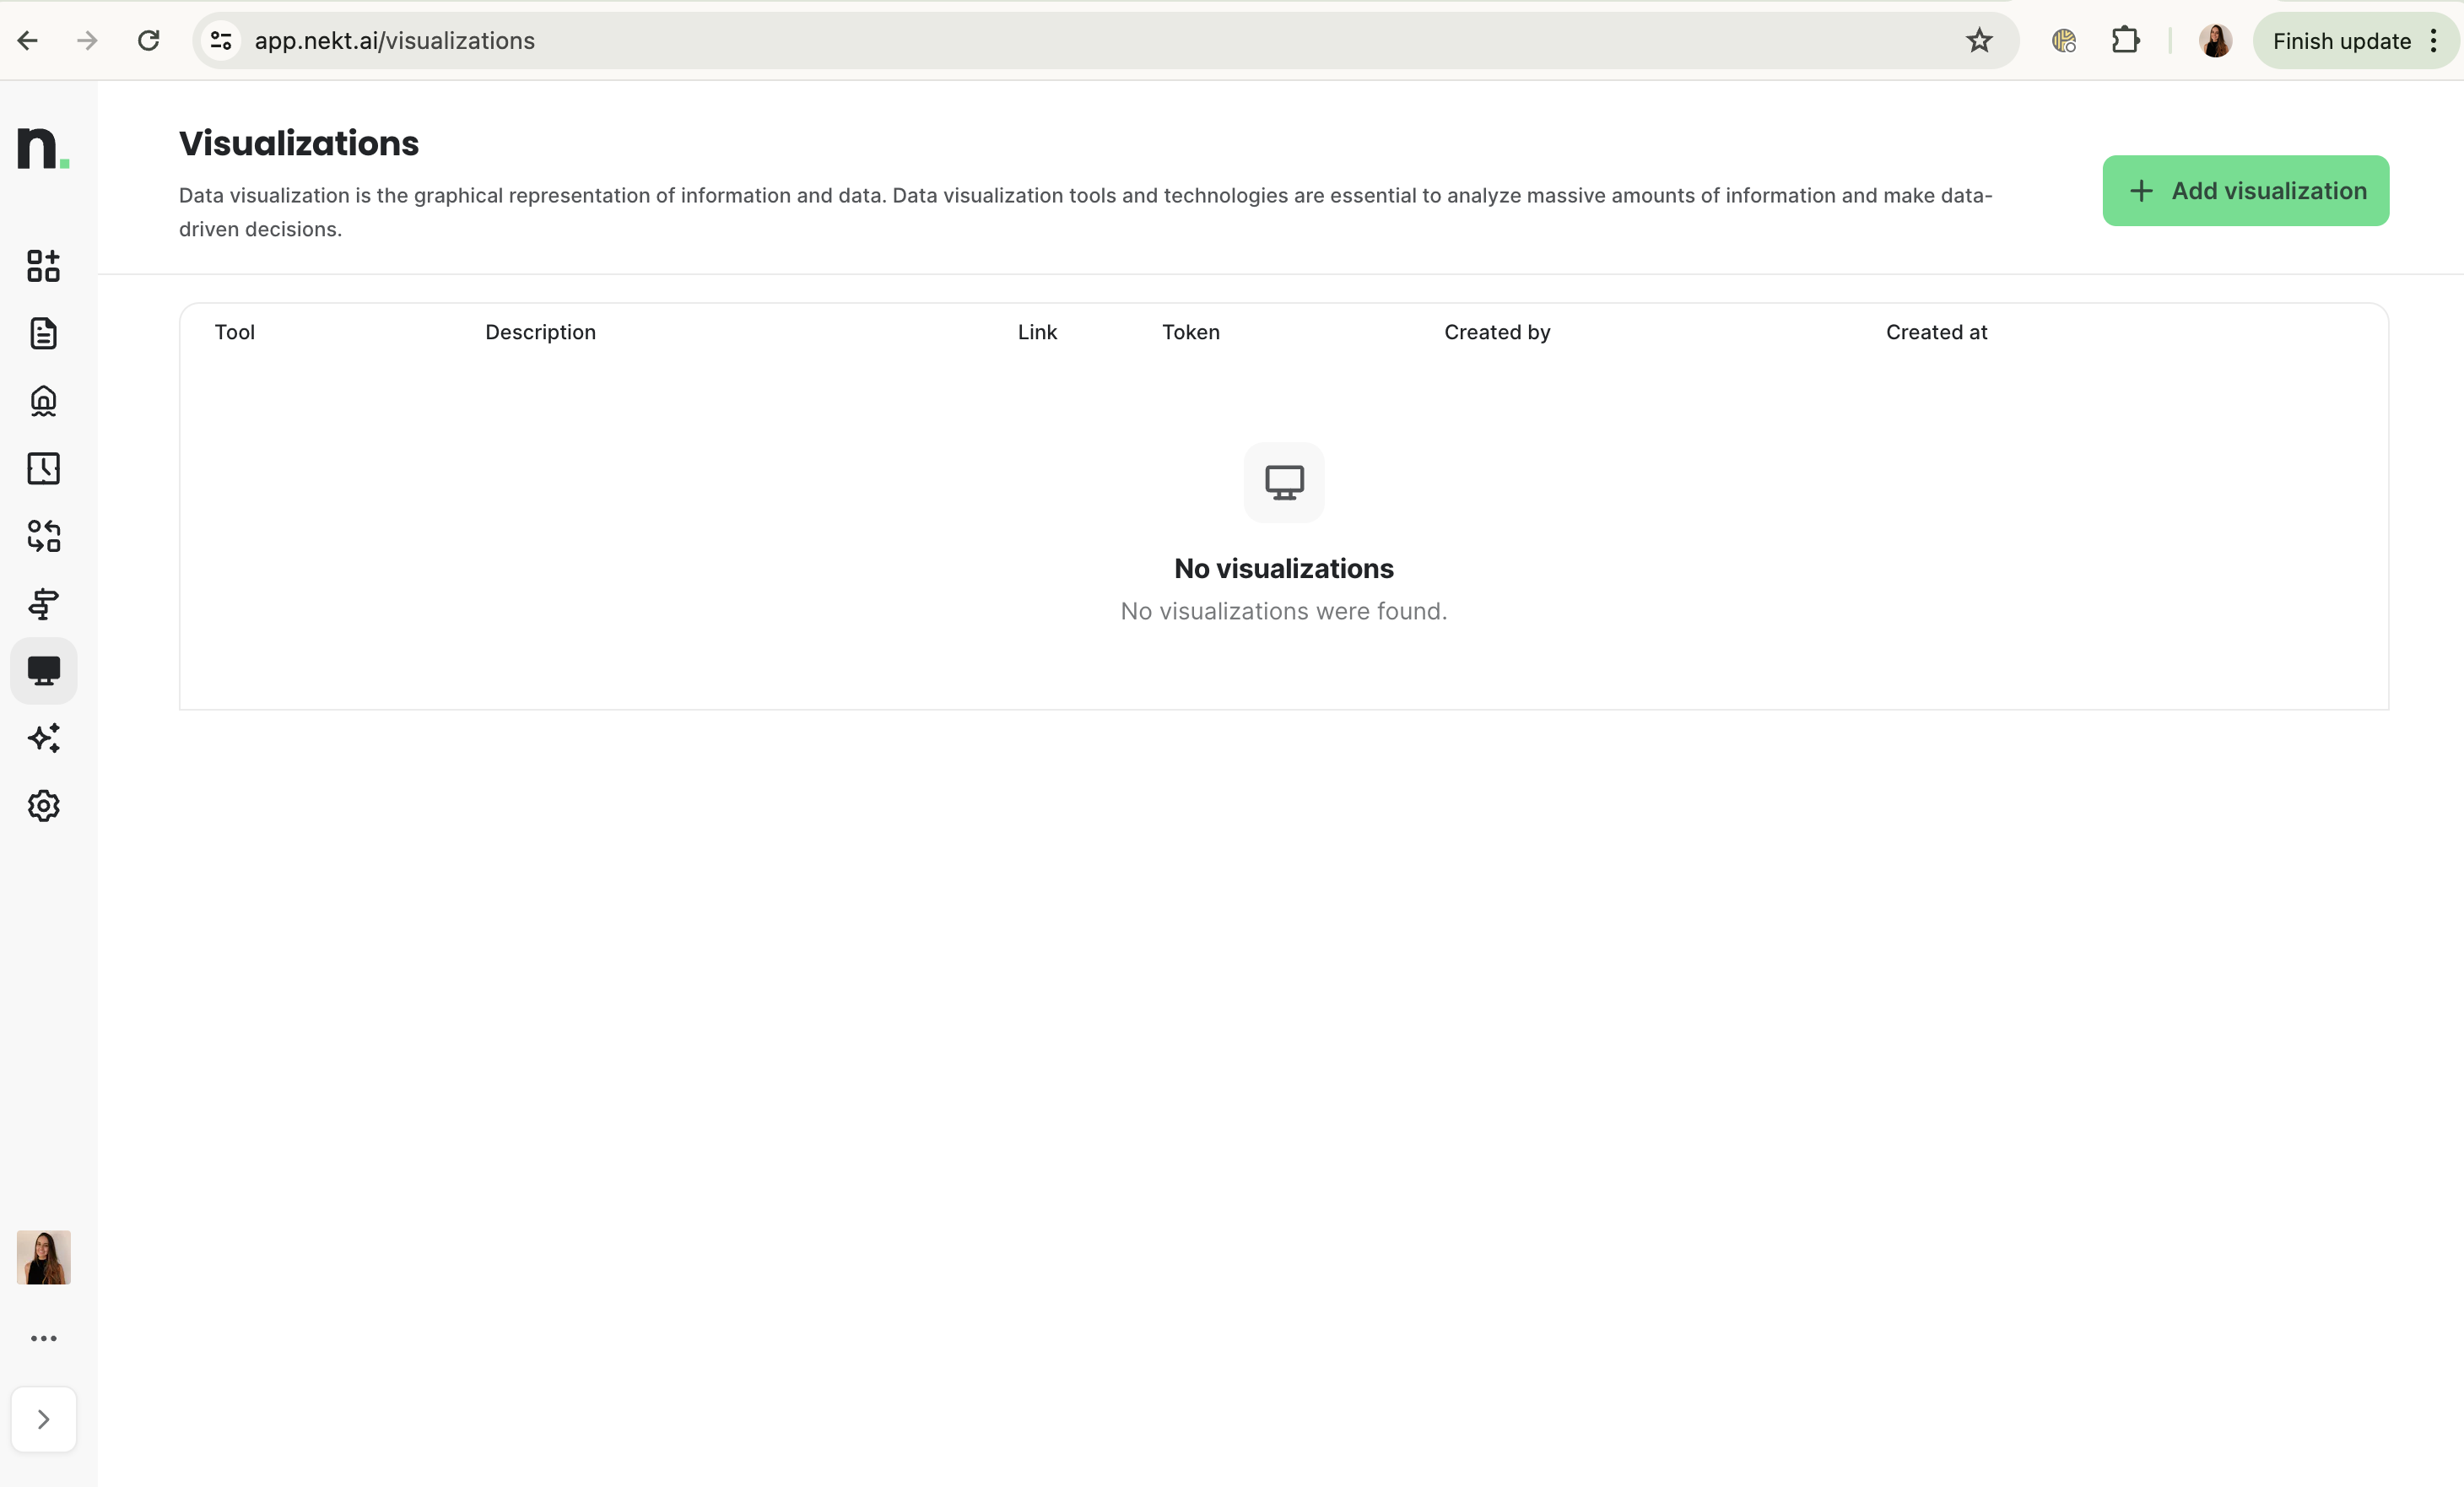
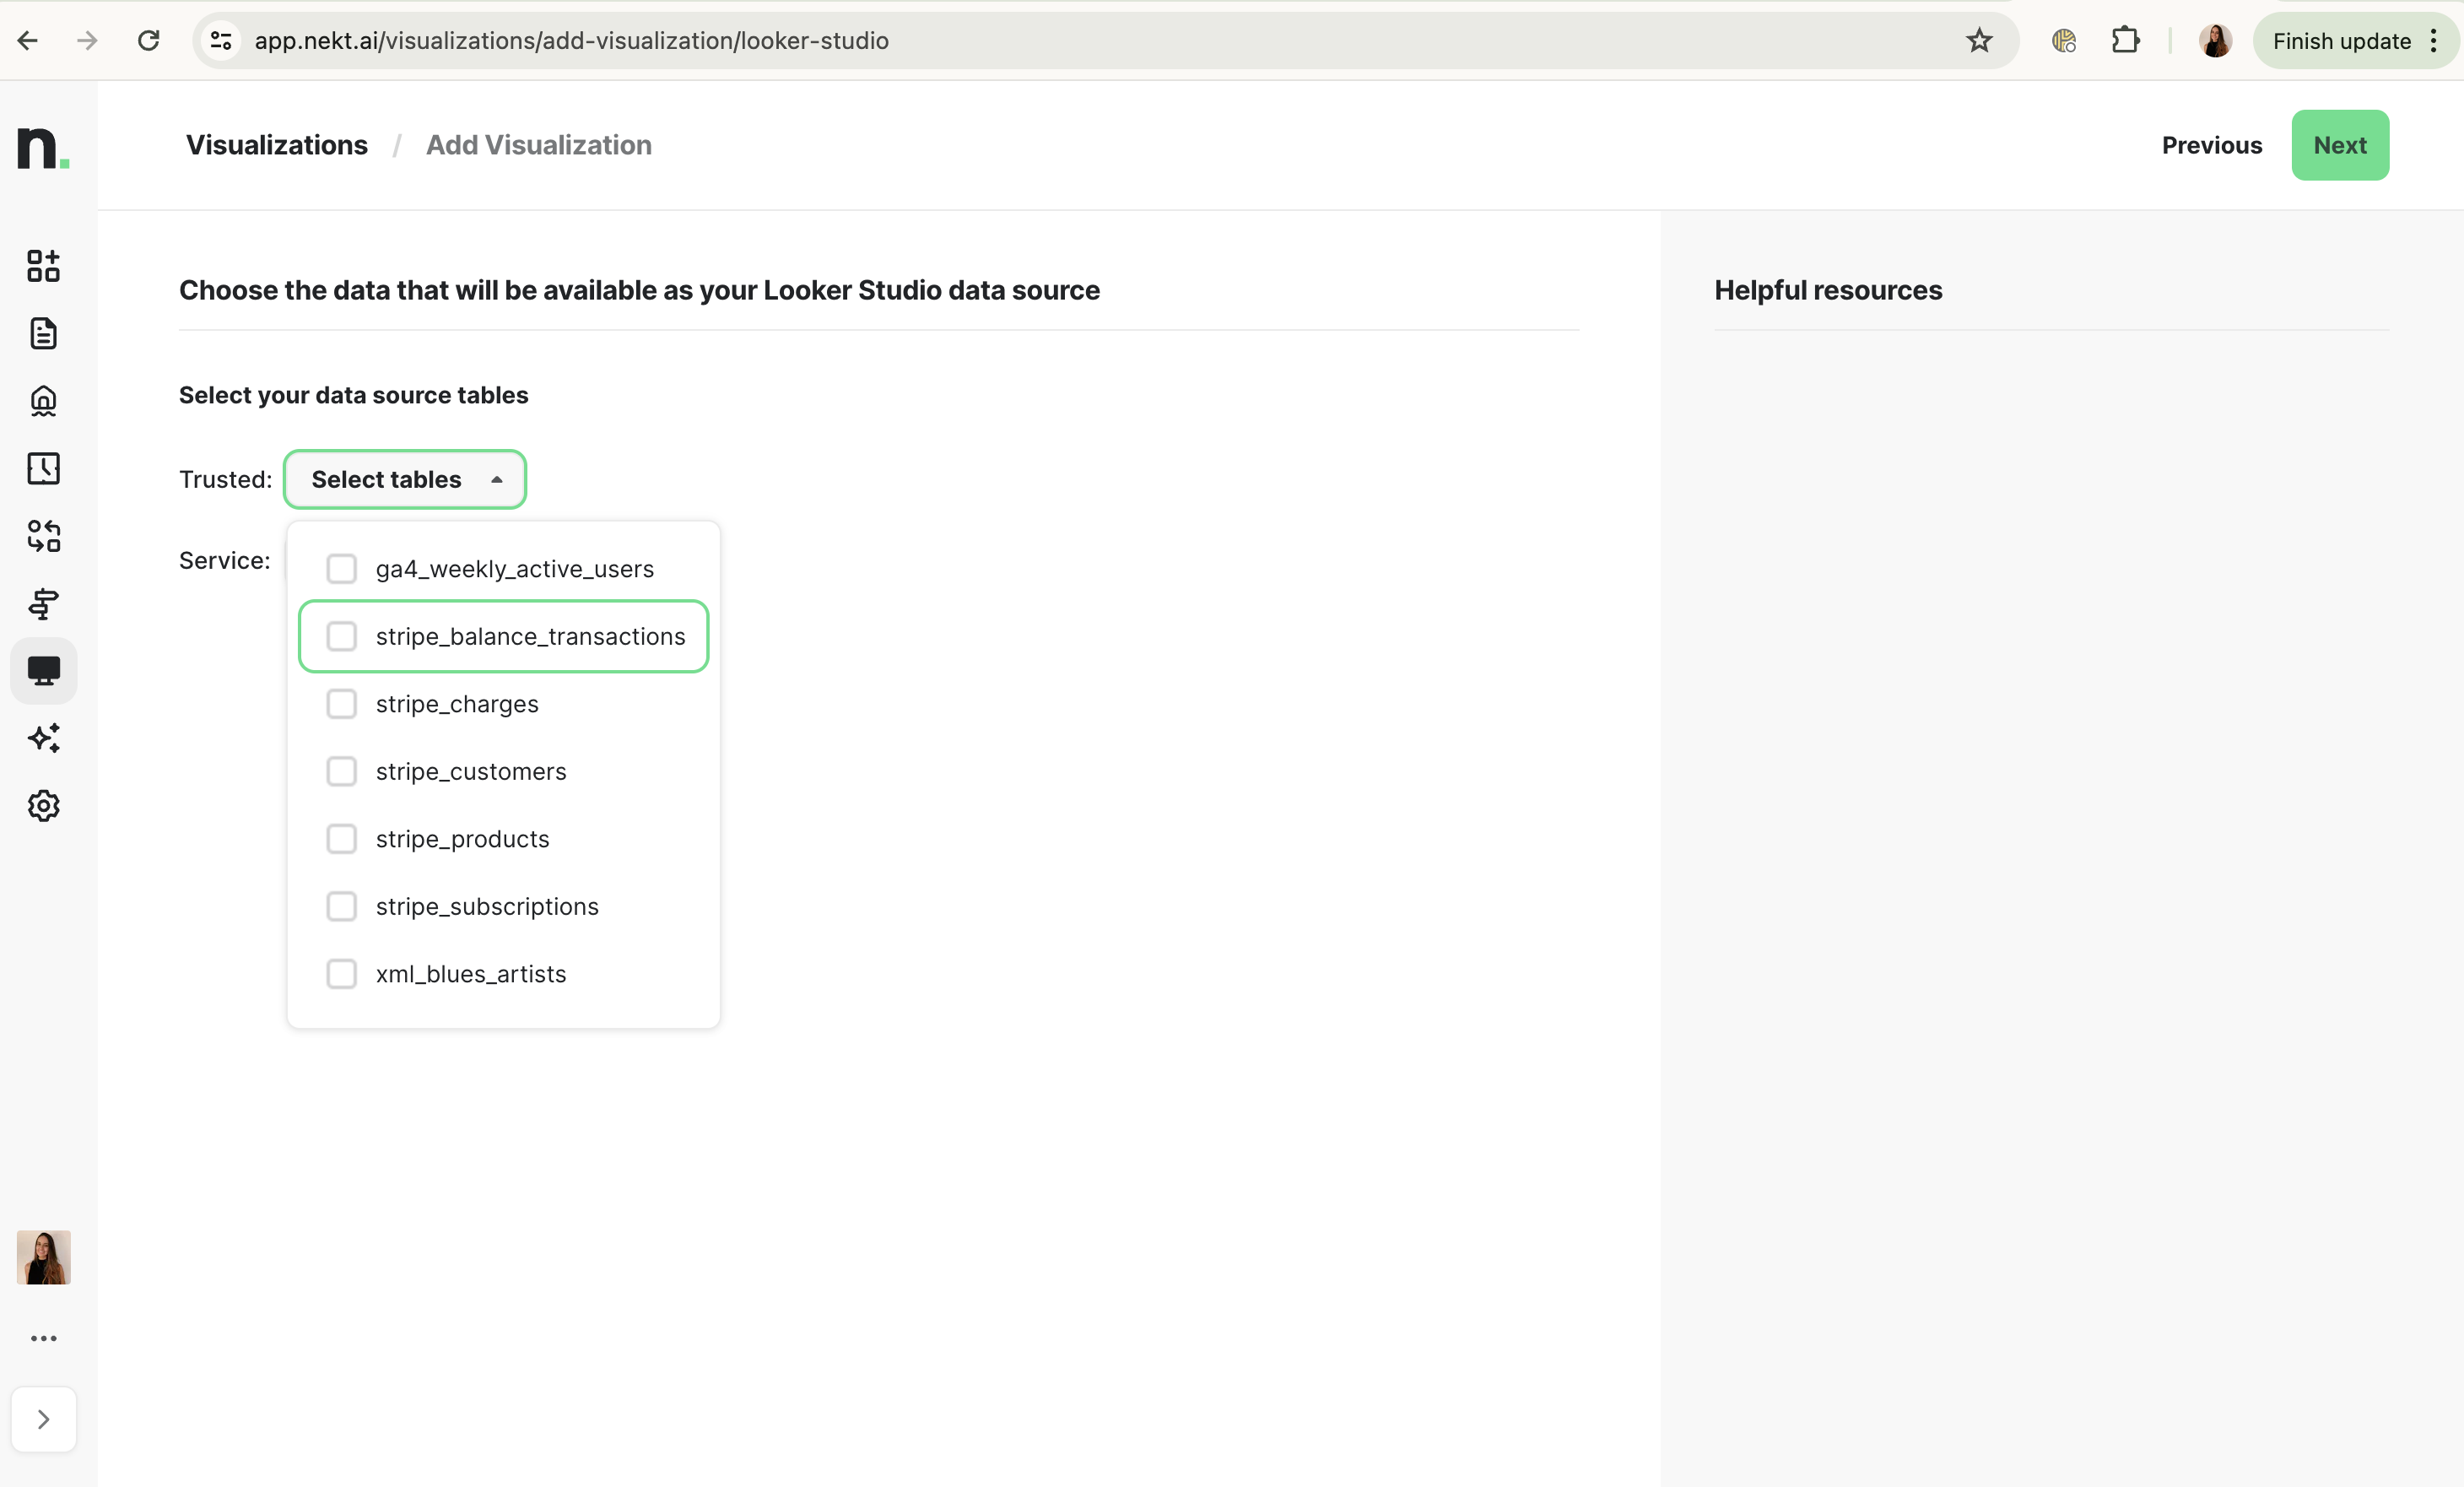
2. Configure your token
Select the tables you want to use now. From each layer of your lakehouse, you can select as many tables as you want.The generated token will allow you to connect only with the tables you select in this moment. You can generate multiple tokens to give access to different sets of tables - which is useful for data governance for example.
3. Configure your visualization
Give your visualization a description - it will appear on the Visualizations page later and will be helpful to identify reports that use your data. If you already have a report, you can add a link to it too. You can also add it later, from the Visualizations page.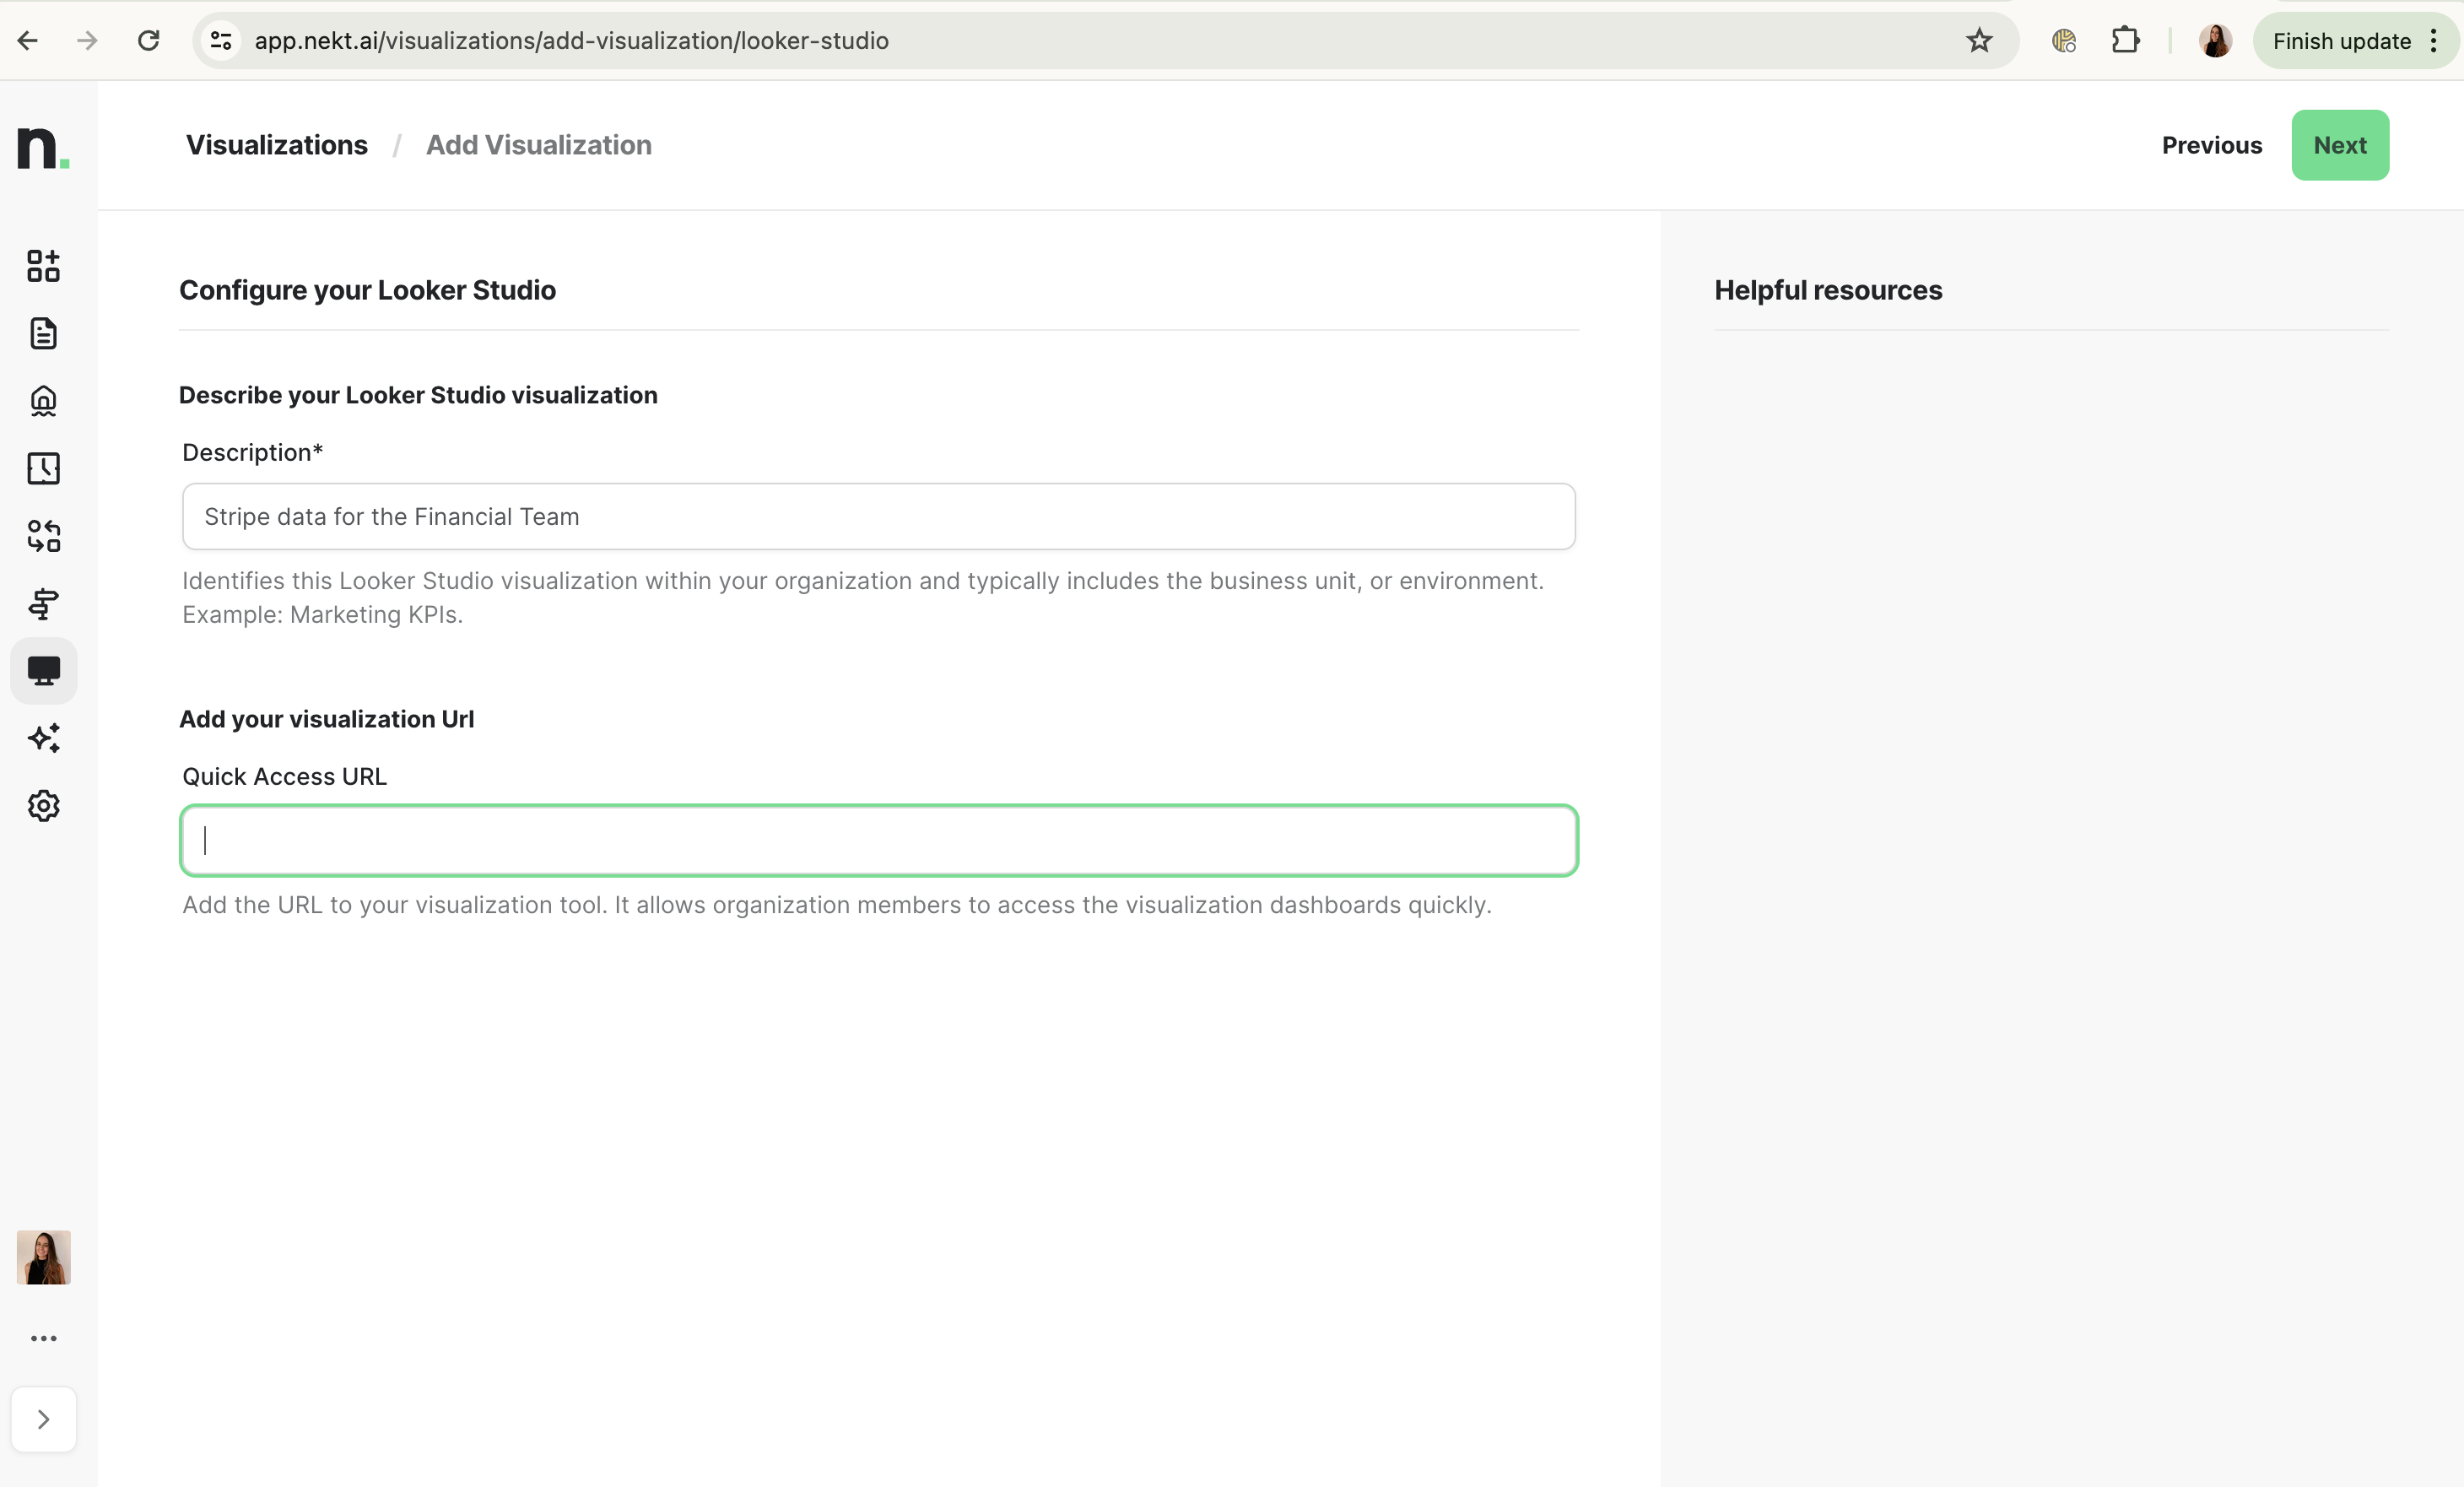
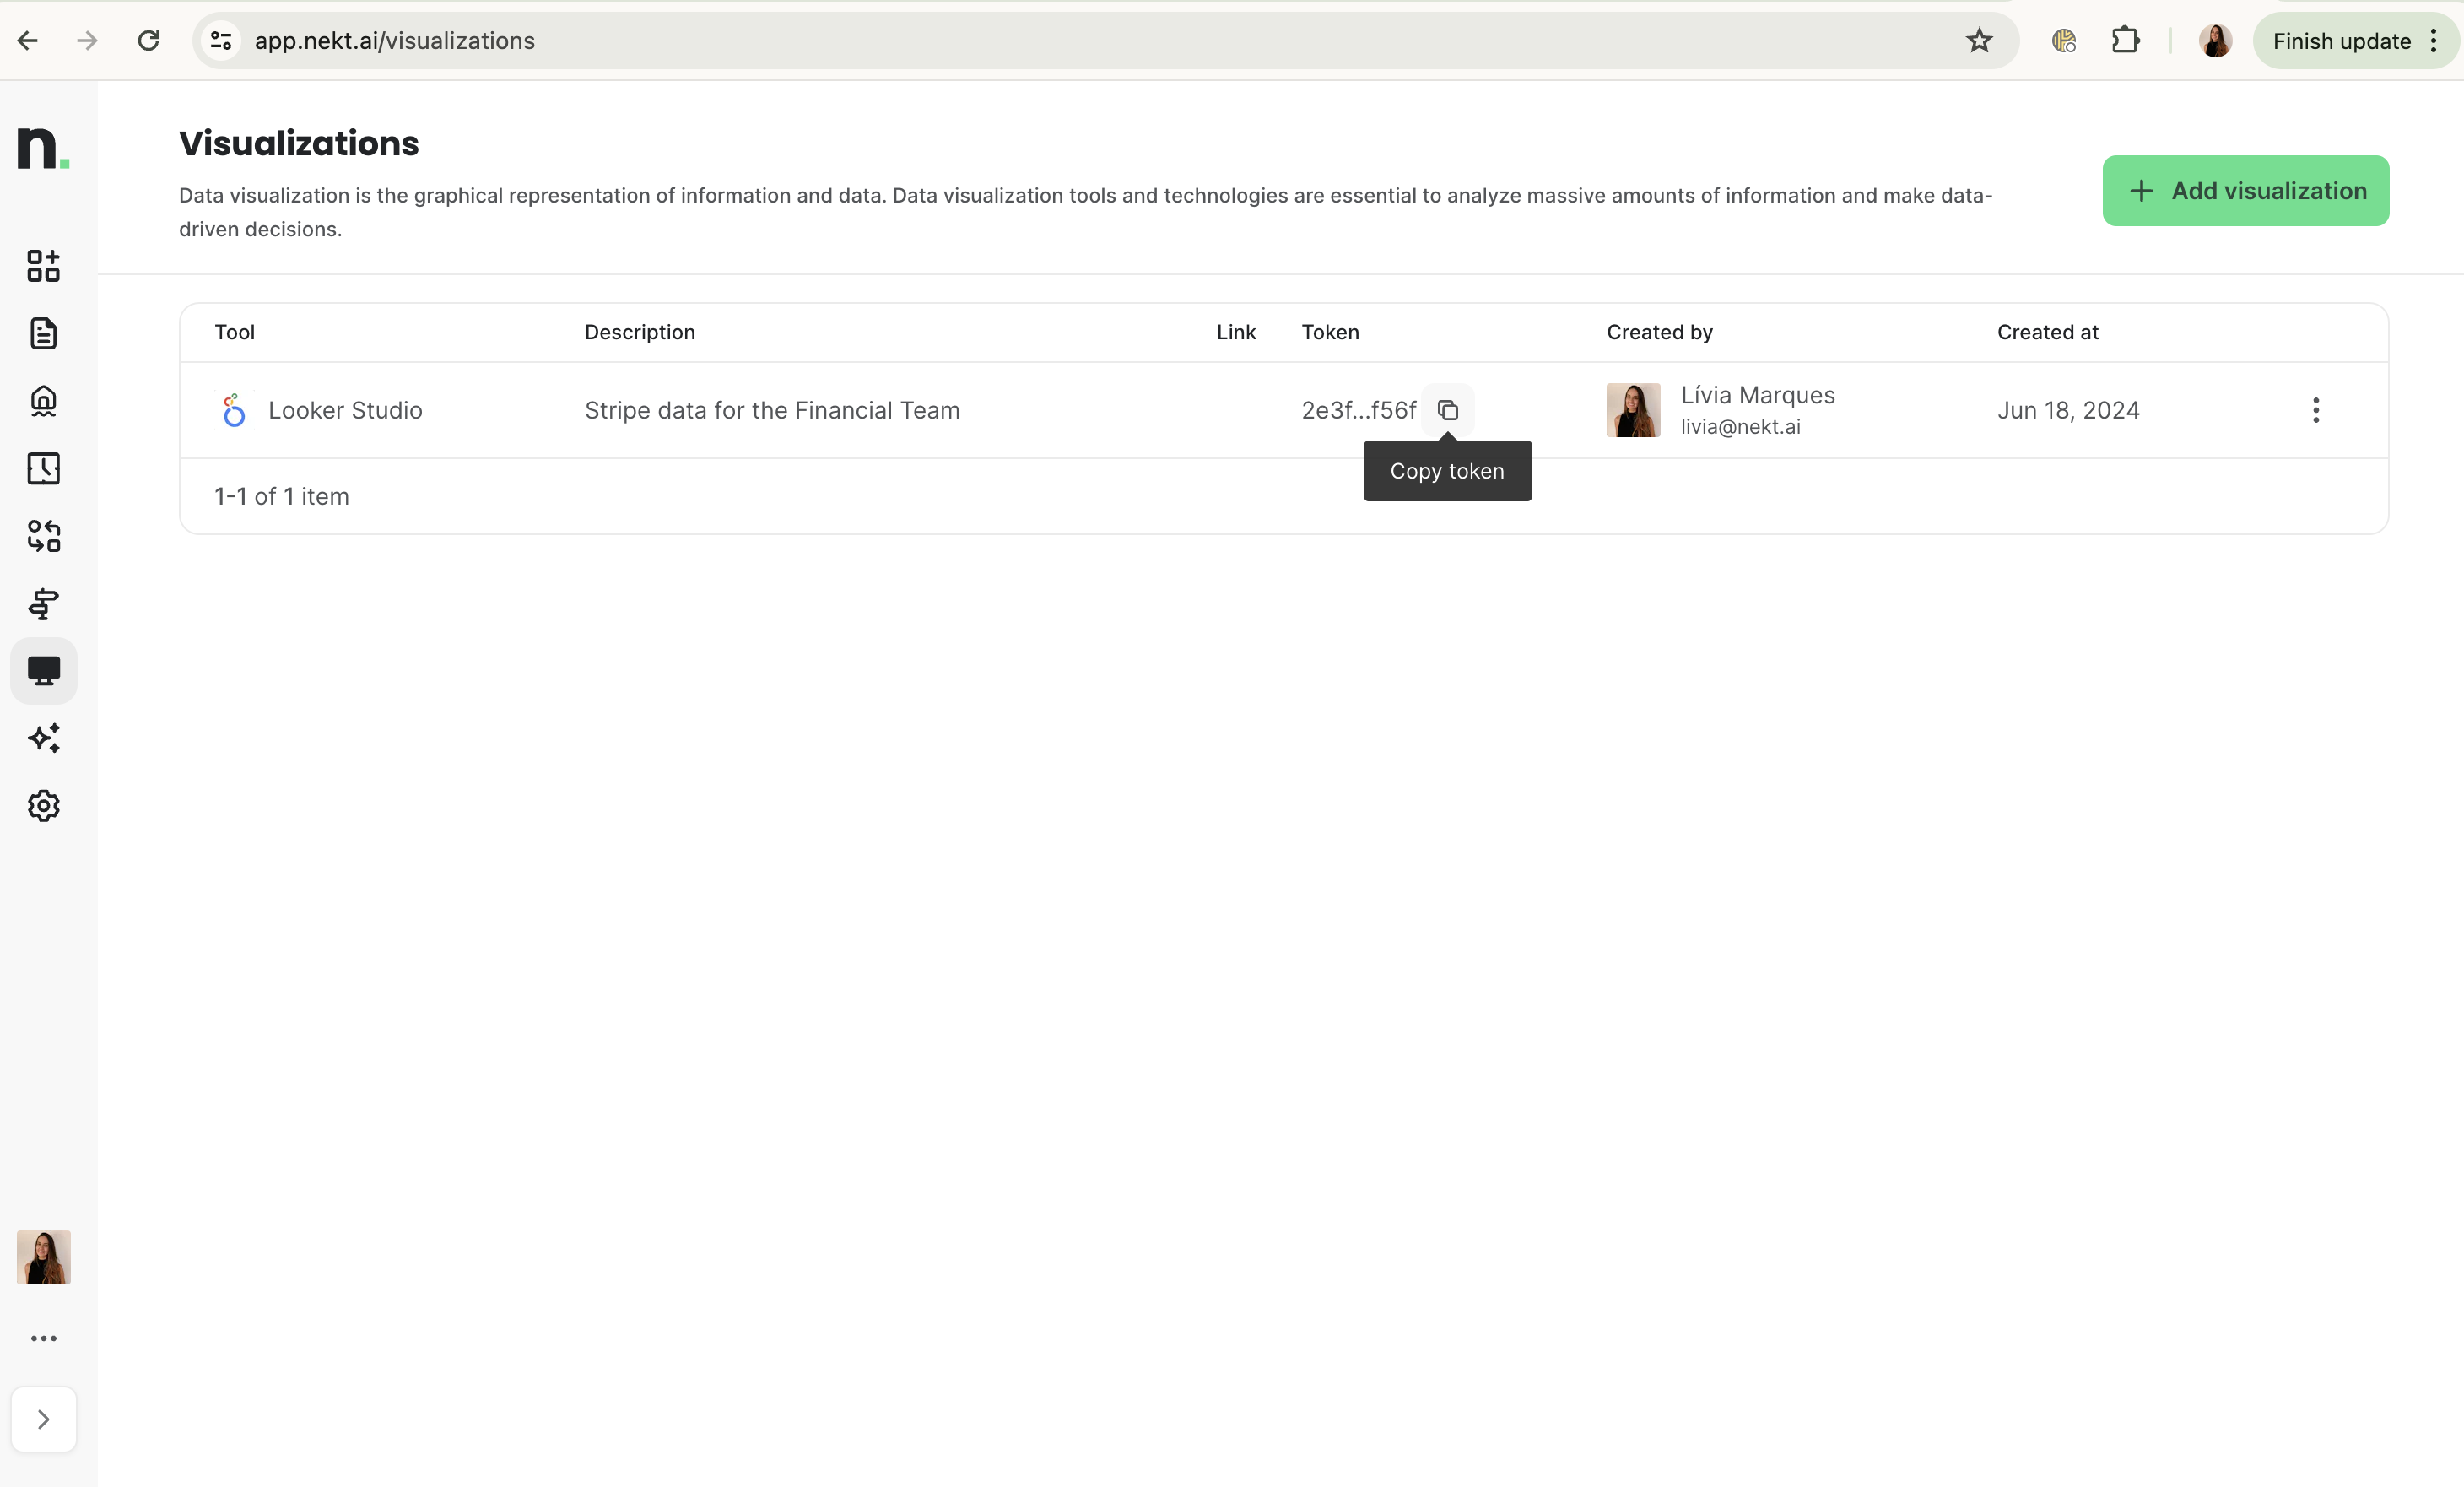
4. Get your token
If everything worked out, you should have received a success message. Go to the Visualizations page to see your added visualization and get your token.